Post-Invasion Price Hikes Do Little to Spur Oil Production
- Share via
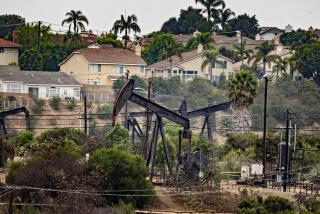
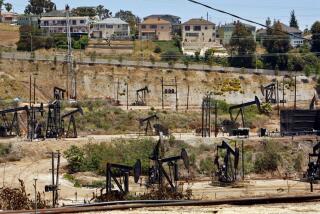
Even though crude oil prices have increased dramatically since the Iraqi invasion of Kuwait, oil wells continue to be plugged and abandoned at a record pace in Orange County. By the end of September, 571 wells were sealed, nearly twice the total in 1989.
Local oil industry experts cite dwindling reserves, previously low oil prices and encroaching development as the cause.
Most of Orange County’s oil wells were once located in Huntington Beach, with thousands of wells producing up to 10 million barrels a year in the 1920s. But in September of this year, only 532 onshore wells remained, producing less than two million barrels a year.
Last month, Chevron USA began abandoning its remaining 125 wells in Huntington Beach after winning approval to develop Holly-Seacliff, the site of the city’s first oil gusher. All of Chevron’s wells in the area will be gone by the end of the year, since the Chevron-owned Huntington Beach Company plans to build 3,780 homes on the 768-acre site, which adjoins Bolsa Chica State Ecological Reserve.
The picture is similar elsewhere in the county, with oil wells giving way to future housing sites. Last year, the remaining wells in the once-productive Kraemer field near Anaheim Hills were removed. Many of the wells removed this year were located in the Coyote West field, also operated by Chevron USA.
O. C. Oil Fields’ 1989 Estimated Reserves in thousands of bbls Belmont: 11,309
Beta (U.S.): 108,939
Brea-Olinda: 52,804
Coyote East: 12,651
Coyote West: 6,834
Esperanza: 181
Huntington Beach: 67,503
Kraemer: 127
Newport West: 18,020
Olive: 683
Richfield: 26,169
Seal Beach: NA
Sunset Beach: 124
Yorba Linda: 20,634
Oil Field Production
Monthly Avg. ‘85-’89 199 Production (bbl.) Percent Product Field 1985 1989 Change Jan.-July Belmont (1) 53.9 35.3 -34.5 17.3 Brea-Olinda 186.8 147.6 -21.0 162.5 Coyote East 55.6 43.5 -21.8 46.2 Coyote West 67.4 48.6 -27.9 48.4 Esperanza 1.4 1.2 -13.9 1.1 Huntington Beach (2) 673.0 399.2 -40.7 327.3 Kraemer (3) 2.2 .1 -99.0 N/A Newport West (2) 86.6 49.4 -43.0 44.3 Olive 3.3 3.0 -8.4 2.9 Richfield 142.2 110.0 -22.7 96.9 Seal Beach 24.8 22.2 -10.4 21.5 Sunset Beach 1.0 .6 -40.7 .6 Yorba Linda 157.5 94.8 -39.8 75.0 Beta (U.S.) 528.5 469.1 -11.2 453.3 County Total: 1,455.7 955.2 -34.4 844.0 State Total: 3,532.1 2,759.8 -21.9
0 Avg. ion (bbl.) Pct. Field Aug.-Sept. Change Belmont (1) 0.0 NA Brea-Olinda 159.0 -2.2 Coyote East 46.9 +1.5 Coyote West 42.1 -13.0 Esperanza 1.2 +9.1 Huntington Beach (2) 313.3 -4.3 Kraemer (3) N/A N/A Newport West (2) 46.4 +4.7 Olive 3.3 +13.8 Richfield 93.2 -3.8 Seal Beach 22.5 +4.7 Sunset Beach .7 +16.7 Yorba Linda 72.3 -3.6 Beta (U.S.) 417.6 -7.9 County Total: 796.1 -5.7 State Total:
N/A -- Not available. (1) Production facilities shut down in June, 1990, for repair and maintenance. (2) Includes onshore and offshore production (3) Production permanently halted in December, 1989 Production Since Aug. 2 Oil production in the county declined 5.7% in the two months after Iraq’s invasion of Kuwait on Aug. 2. Brea-Olinda: -2.2% Huntington Beach (2): -4.3% Newport West (2): +4.7% Richfield: -3.8% Yorba Linda: -3.6% Plugged and Abandoned Wells: More than twice as many wells were plugged in the first nine months of 1990 than in all of 1989. 1985: 21 1986: 36 1987: 60 1988: 157 1989: 276 1990: 571 (Jan.-Sept.) Source: California Department of Conservation - Division of Oil and Gas
More to Read
Sign up for Essential California
The most important California stories and recommendations in your inbox every morning.
You may occasionally receive promotional content from the Los Angeles Times.


